
TL;DR
- A pod reporting
Pendinghas either never been assigned to a node, or has been assigned one and is still preparing containers. Check theNODEcolumn before anything else. - The scheduler records a
FailedSchedulingevent on every failed attempt, and that event names the constraint that rejected each node. - A request larger than every available node's allocatable CPU, unmatched or contradictory selectors, and
hostPortcollisions can keep pods Pending. Adding nodes helps only if the new nodes satisfy the pod's requirements. - Pods held by
.spec.schedulingGatesreportSchedulingGatedand produce no scheduler event at all.
A deploy goes out, one replica never comes up, and the rollout sits at 2 of 3 updated. kubectl get pods reports Pending, and kubectl describe pod gives you either a dense block of scheduler text to decode or, worse, an empty Events section. The reflex is to assume the cluster is out of CPU and go add a node, which is sometimes correct and frequently a waste of the next twenty minutes.
In this article, we use the event the scheduler already recorded to find out why a specific pod is Pending, and we separate the causes that clear up on their own from the ones that will never schedule no matter how long you wait.
Before you start
You need kubectl 1.27 or later pointed at a cluster where you can create pods, plus permission to read pods, nodes, events, and persistent volume claims. The local reproduction uses kind, but any single-node cluster works. The scheduling gates check requires Kubernetes 1.30 or later, where that feature is stable.
Check whether the pod was ever scheduled
Pending looks like one state in kubectl output, but it covers two unrelated situations. The Pod Lifecycle documentation defines the Pending phase as a pod that the cluster has accepted but whose containers are not yet ready to run, and it explicitly includes both the time a pod spends waiting to be scheduled and the time it spends pulling images over the network. Those are different failures with different fixes, and the STATUS column does not tell you which one you have.
The column that does is NODE. Running kubectl get pods -o wide adds it to the default output:
kubectl get pods -o wideNAME READY STATUS RESTARTS AGE IP NODE NOMINATED NODE READINESS GATES
api-7d9c8f6b5-2xk4p 0/1 Pending 0 4m <none> <none> <none> <none>
worker-6b8f7d9c4-jl9vq 0/1 Pending 0 4m 10.0.1.7 node-2 <none> <none>
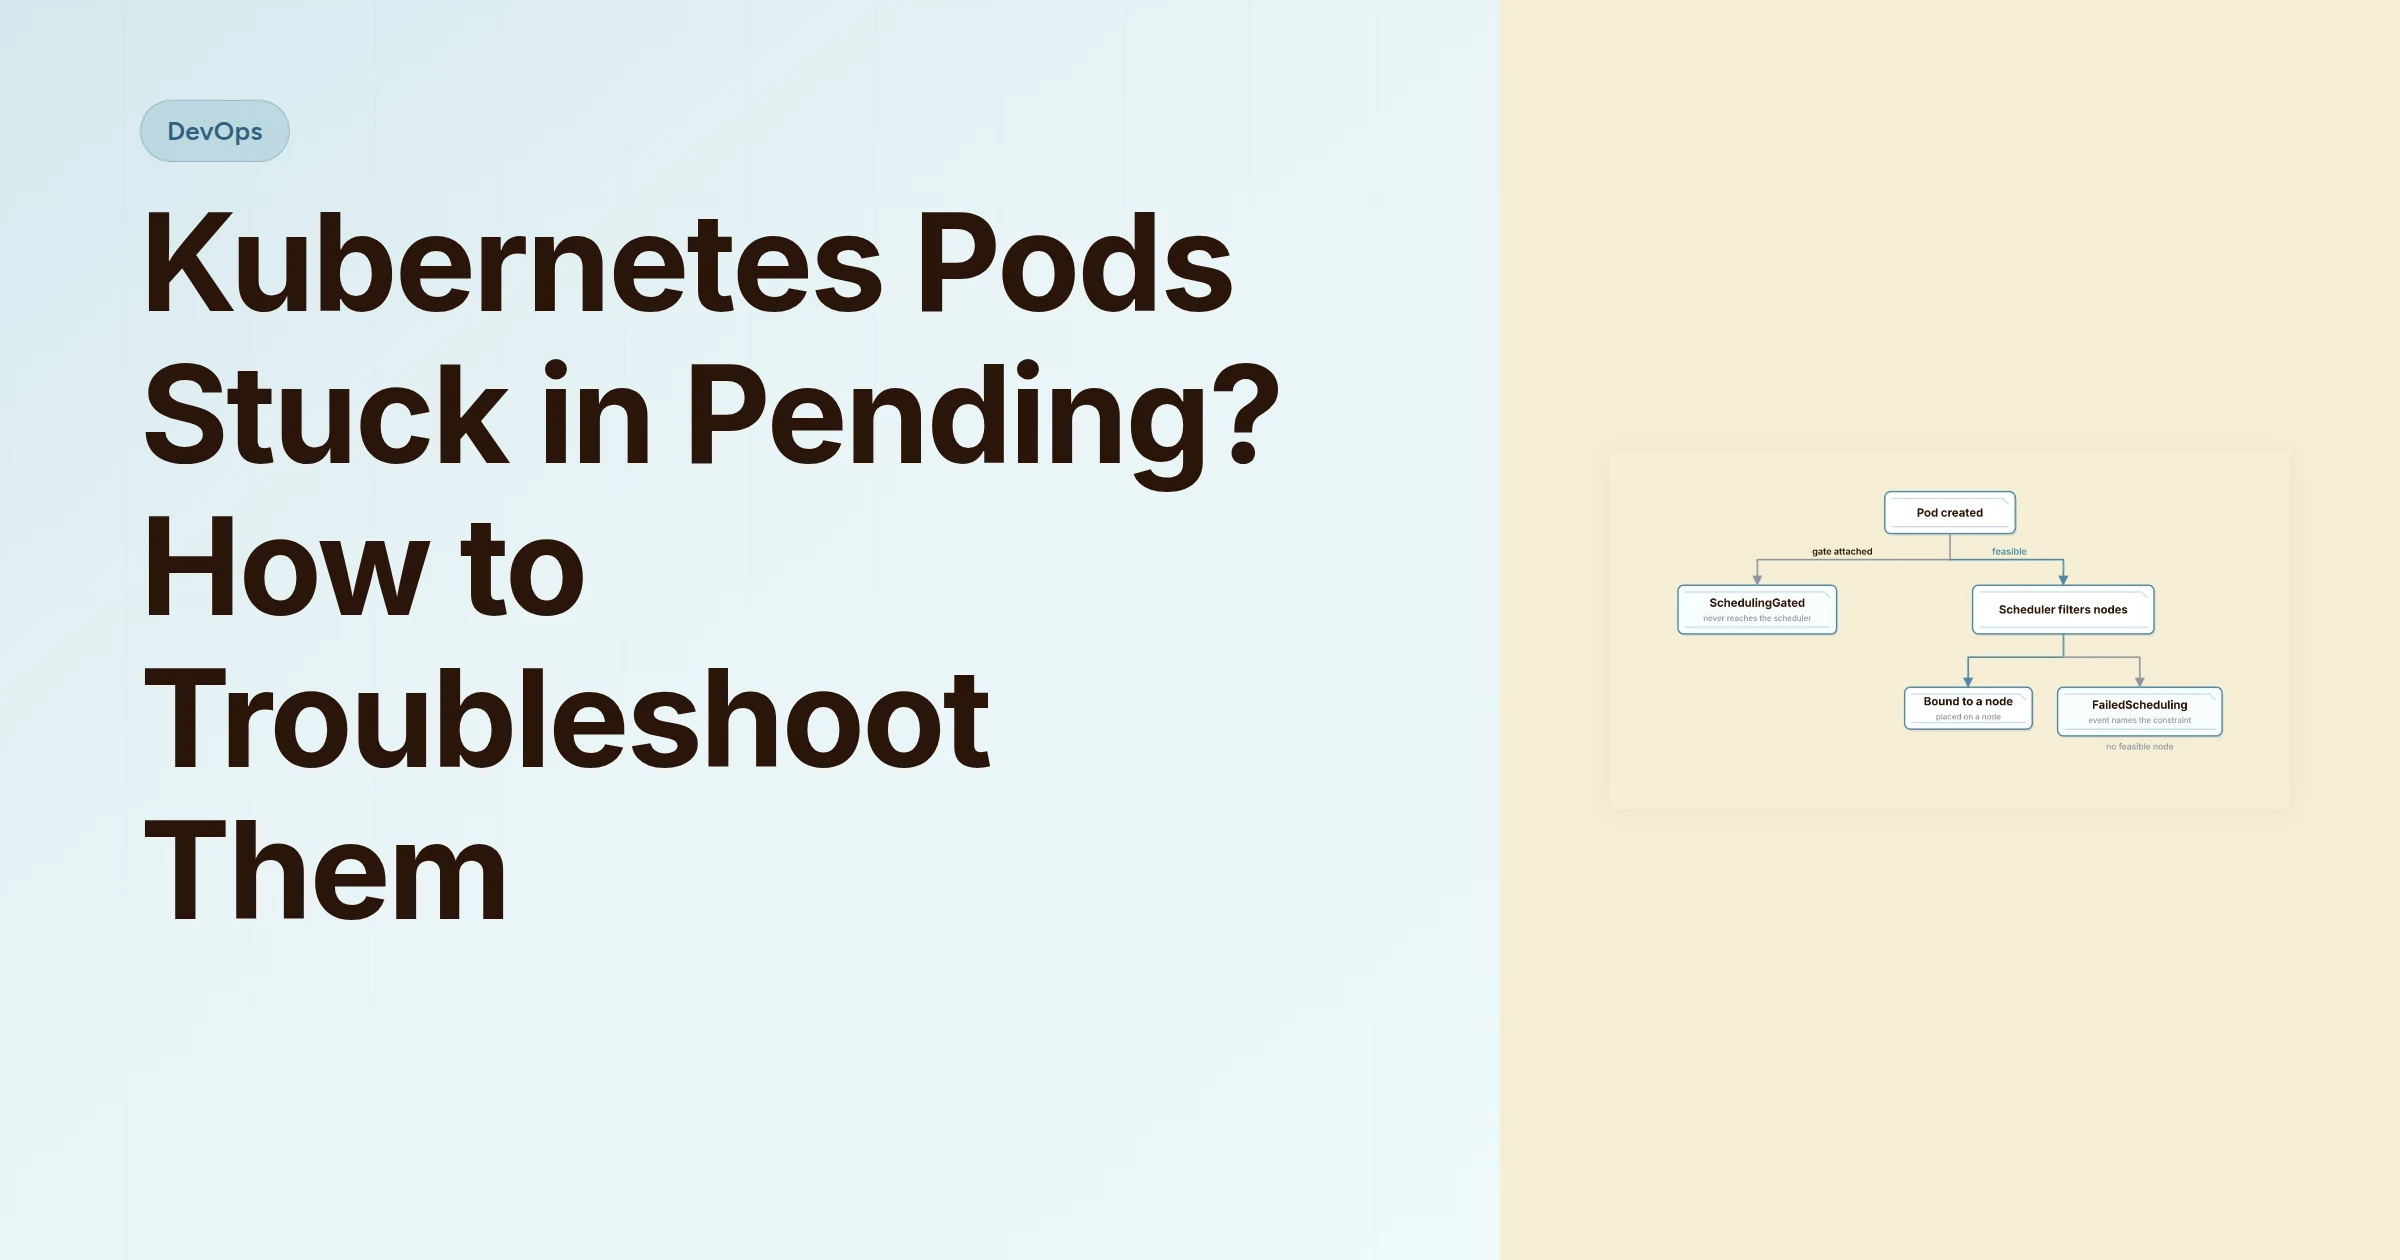
checkout-5f6d7c8b9-qz2wm 0/1 SchedulingGated 0 4m <none> <none> <none> <none>Three pods, three different problems. The first has no node, so the scheduler never placed it. The second has a node and an IP address, which means scheduling succeeded and the pod is stuck later in startup, usually on an image pull or a volume mount. The third has not reached the scheduler at all.
That last row is worth pausing on. Kubernetes' own documentation warns against confusing the STATUS column with a pod's phase, because STATUS is display text assembled for humans. CrashLoopBackOff and Terminating appear there without being phases, and SchedulingGated is another of those display values. Read it as a hint, then confirm against the object itself.
| What you see | What it means | Where to go |
|---|---|---|
Pending, NODE is <none> | Never scheduled. The scheduler could not place it. | Read the event, next section |
Pending, NODE is set | Scheduled. Containers are being created or images pulled. | Image pull and volume checks, not scheduling |
SchedulingGated | Held before the scheduling queue by a gate | Remove the gates |
Once you know the pod was never placed, the next question is what the scheduler was checking when it gave up.
Why the scheduler leaves a pod pending
The Kubernetes scheduler watches for newly created pods that have no node assigned and picks a node for each one. It works in two stages. Filtering produces the set of nodes where the pod could actually run, and scoring ranks the survivors. A node that passes filtering is called feasible, and if the feasible set is empty, the pod stays unscheduled until something changes.
The filter that matters most for a Pending pod is PodFitsResources, which compares the pod's resource requests against what each node has available. Requests, not live usage. A node showing 30 percent memory used in your monitoring dashboard can still reject a pod whose request exceeds its remaining allocatable memory, because the scheduler never consults that dashboard. It adds up requests and compares them to capacity.
Scheduling is also a loop rather than a single decision. The scheduler retries on a backoff, so a pod that cannot be placed right now may be placed in a few minutes when a neighbouring pod is deleted or a new node joins the cluster. That is why "it fixed itself" is a real outcome, and why the first thing to establish is whether the constraint in front of you is temporary.
Every failed pass through that filter produces an event, and the event is the fastest route to the cause.
Read the FailedScheduling event
The scheduler emits an event each time it fails to find a place for a pod, so the reason is recorded rather than inferred. Read it with kubectl describe pod and look at the Events block at the bottom:
kubectl describe pod api-7d9c8f6b5-2xk4pEvents:
Type Reason Age From Message
---- ------ ---- ---- -------
Warning FailedScheduling 45s (x6 over 4m) default-scheduler 0/3 nodes are available: 1 node(s) had untolerated taint {dedicated: build}, 2 Insufficient cpu. preemption: 0/3 nodes are available: 3 No preemption victims found for incoming pod.The shape of the message is always the same. It reports how many nodes were considered, then lists the reasons the rest were rejected, grouped by count. Here, one node was tainted and two lacked CPU. On a cluster with more nodes, you get a longer list and a clearer picture of which constraint is doing the damage.
The wording shifts slightly between Kubernetes versions, so match on meaning rather than exact text.
| What the message points at | What rejected the node | Where to look |
|---|---|---|
| Insufficient CPU | PodFitsResources | Node allocatable CPU against pod requests |
Insufficient memory, sometimes reported as PodExceedsFreeMemory | PodFitsResources | Node allocatable memory against pod requests |
| A node affinity or node selector mismatch | Node affinity or nodeSelector | Labels on the node against the selector in the spec |
| An untolerated taint | Taints and tolerations | Taints on the node against tolerations on the pod |
| No nodes available at all | The cluster has no schedulable nodes | kubectl get nodes |
If the Events block is empty on a pod that has been Pending for a while, the records have aged out rather than never existing. Recreate the pod to regenerate the event, or query the events API with a wider time window, before concluding the scheduler had nothing to say.
Some of these messages describe a shortage that will clear on its own. Others describe a pod that will never fit.
The pending pods that never resolve on their own
Most guidance treats Pending as a capacity problem and stops there. Some pods need a configuration change; others need nodes that satisfy specific requirements. Work through these six checks before you touch the node count.
-
The request is larger than any node. A pod that requests
1.1CPUs on nodes with a capacity of1CPU will never be scheduled. The documentation states this directly, and it is a permanent condition. Compare against the node's allocatable CPU, not its total capacity. -
Allocatable is lower than capacity. The kubelet reserves CPU and memory for system daemons, so a node that advertises 4 CPUs typically reports around
3920mas allocatable. A pod requesting a full4CPUs does not fit on a node that looks completely empty. This is the case that produces the "but nothing is running on that node" reaction.
kubectl describe nodes node-2Capacity:
cpu: 4
memory: 16303008Ki
pods: 110
Allocatable:
cpu: 3920m
memory: 15954752Ki
pods: 110-
No eligible node matches both
nodeSelectorand requirednodeAffinity. When both are set, both must be satisfied. A selector pointing atpool=generalcombined with a required affinity fordisktype=ssdonly schedules on nodes carrying both labels. Those requirements are compatible, but a node pool relabelled last quarter can quietly remove the last node that qualified. A true contradiction, such as requiringpool=generalwhile required affinity only allowspool=specialized, cannot be satisfied by any node. Adding nodes helps only when the new nodes meet every requirement. -
hostPortcaps the replica count. Binding a pod to a host port limits where it can run, because pods with conflicting host IP, port, and protocol requirements cannot share a node. A deployment with four replicas requesting the samehostPort, withhostIPandprotocolleft at their defaults, leaves one Pending on a three-node cluster even when all three nodes are otherwise eligible and the port was initially available. The documentation recommends a Service in most cases, and it is right to. -
The claim never binds. A persistent volume claim stays unbound indefinitely when no matching volume exists, and the pod that needs it stays Pending with it. A claim can also sit pending when the volume it names is already bound to a different claim, which happens on restores and on manually provisioned volumes.
-
Scheduling gates are still attached. Pods can carry
.spec.schedulingGates, which hold them before they enter the scheduling queue. These pods reportSchedulingGatedand generate noFailedSchedulingevent, so any method that starts by reading events returns nothing at all.
kubectl get pod checkout-5f6d7c8b9-qz2wm -o jsonpath='{.spec.schedulingGates}'[{"name":"example.com/awaiting-config"}]If none of those six apply, the constraint is probably temporary, and the next section is where to start.
How to fix it
Work through the fixes in this order. The first step decides which of the others you need, and skipping it is how people end up adding nodes to a cluster whose real problem is a typo in a label selector.
- Read the event and classify the constraint. Capacity, node requirements, or pod configuration. More nodes help only when the new nodes satisfy the pod's requirements; spec conflicts need a spec change.
- For genuine capacity pressure, free space by removing pods you do not need, lowering requests to what the workload actually uses, or adding nodes.
- For a request above allocatable, lower the request or move the workload to a larger node pool.
- For taints, add a matching toleration or remove the taint. Remember that
NoScheduledoes not evict pods already running, so a tainted node can look busy while rejecting every new pod. - For a cordoned or NotReady node, uncordon it or let it recover. A node marked unschedulable carries a taint that keeps new pods off it.
- For an unbound claim, create a matching persistent volume or confirm the namespace has a default StorageClass.
- For gated pods, remove the gates from the spec and reapply.
- For quota problems, fix the create call rather than the pod. An exhausted quota rejects the request with
403 Forbiddenat admission, so no Pending pod ever exists to debug.
The fastest way to see a permanent case for yourself is to ask for more CPU than a single node has. On a kind cluster, a request of 64 CPUs is safely above the allocatable capacity of a laptop node.
apiVersion: v1
kind: Pod
metadata:
  name: oversized
spec:
  containers:
    - name: app
      image: nginx:1.27-alpine
      resources:
        requests:
          cpu: "64"
          memory: 4Gi
Apply it, then read the event:
kubectl apply -f oversized.yaml
kubectl describe pod oversized
Events:
Type Reason Age From Message
---- ------ ---- ---- -------
Warning FailedScheduling 8s default-scheduler 0/1 nodes are available: 1 Insufficient cpu. preemption: 0/1 nodes are available: 1 No preemption victims found for incoming pod.Lower the request to 250m, recreate the pod, and the same manifest schedules immediately.
kubectl delete pod oversized
kubectl apply -f oversized.yaml
kubectl get pod oversized
NAME READY STATUS RESTARTS AGE
oversized 1/1 Running 0 12sHow to verify the pod actually schedules
A pod reporting Running is the obvious signal, but check the condition that matters rather than the display string, because the two can disagree during a rollout.
kubectl get pod oversized -o jsonpath='{.status.conditions[?(@.type=="PodScheduled")].status}'TrueThe same pattern covers the other checks in this article. A claim that bound reports Bound, a cleared gate returns an empty result, and a rollout that was hanging finishes.
kubectl get pvc data-0
kubectl get pod checkout-5f6d7c8b9-qz2wm -o jsonpath='{.spec.schedulingGates}'
kubectl rollout status deployment/api
If the PodScheduled condition is True and the pod is still not serving traffic, the problem has moved downstream into image pulls, volume mounts, or readiness probes. The scheduling investigation is over at that point, and continuing to look at node capacity wastes time.
When this breaks down
Event-driven debugging is the fastest route for unschedulable pods, and it has real limits worth knowing before you rely on it.
Gated pods produce no event. A pod held by a scheduling gate never reaches the scheduler, so there is no FailedScheduling event and no node-level reason to find. The only signals are the SchedulingGated status and the scheduler_pending_pods{queue="gated"} metric, and that metric exists only if you scrape the scheduler.
Events expire. Event records are retained for a limited window, so a pod that has been Pending for days may show an empty Events block. An empty block means the record aged out, not that the scheduler had nothing to say. Recreate the pod to regenerate it, or query the events API with a wider time window.
A scheduled pod is not a fixed cluster. Preemption can clear a Pending pod by evicting lower-priority pods from a node. The pod you were debugging schedules, the alert resolves, and the cluster is still over-committed. Something else paid for the fix, and the same Pending pod will come back the next time the node fills. Keeping enough headroom to avoid that is a capacity planning problem, and it is one of the reasons teams eventually move from hand-rolled clusters to managed platform engineering.
For a pod that is genuinely unschedulable, the answer is almost always in an event you have not read yet. Read it, decide whether the constraint is capacity or configuration, and only then reach for the node count. If the event is missing, check the gates first, because that is the one case where a silent pod is telling you something specific.